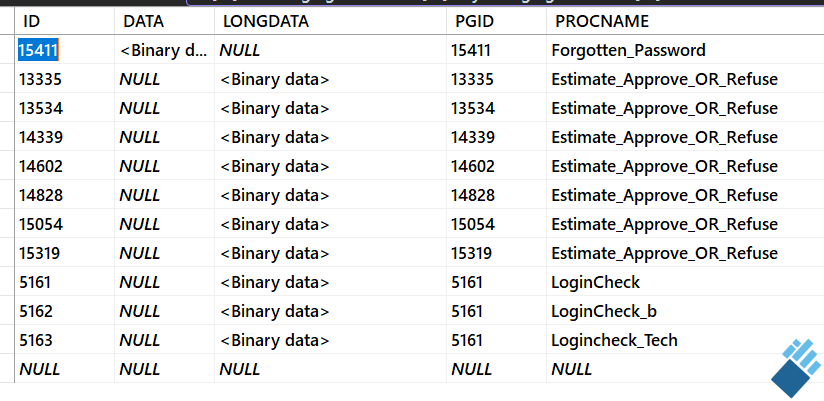
More of this crap today.
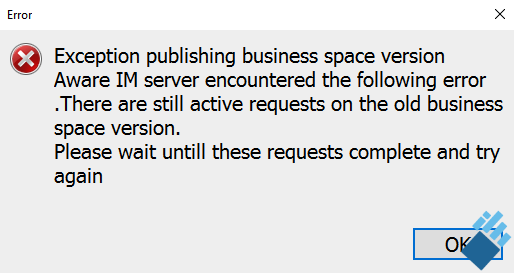
I tried to use the debugger and it just spun in the browser and nothing ever changed in Config Tool.
So I have to lose half a day because I can’t bounce the server. The debugger is what messed this up.
Reference this from 4 years ago:
https://forum.awareim.com/d/12409-this-issue-still-exists-after-14-years
Reference this from 18 years ago:
https://forum.awareim.com/d/2017-message-quot-there-are-still-active-requests-quot
About execution contexts.
Why the hell can’t it show a time stamp for created, or last updated. something…
If a production system, it would help to know the dates:
1) if its an old date, then its prolly safe to delete
2) if its “current”, the don’t delete
3) a date could help us debug a problem to try and correct the behavior. I never have Execution Context issues, while others fill up and they don’t know why.
Seeing a timestamp (which, lets face it, isn’t hard) is easy.
Also, whats PGID? While its not the SessionID, it must be session related because the 3 Login programs in this image are all run when someone logs in…. which happens all day, so why are these 3 stuck? The PGID might help?